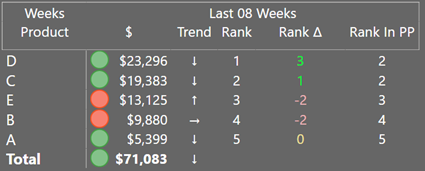
A few posts ago I talked about KPIs and how they can be significantly improved by adding a trend. The question is, however, can we do even better? Can we have a current value, a target and a trend and still add more color to a KPI? Turns out that we can, and we can do it by using rankings.
In this video, I discuss several strategies that we can employ to enhance the analytical context for a KPI as well as the DAX code used in the calculations.
You can download the Power BI Desktop model used in this video here.
Last N Weeks Sales Rank =

var thisPeriodRank=
RANKX(
    ALL('Product'[Product]),
    [Last N Weeks Sales],
    [Last N Weeks Sales],
    DESC
)

return IF(HASONEVALUE('Product'[Product]), thisPeriodRank)
Rank Change =
var thisPeriodRank=
RANKX(
    ALL('Product'[Product]),
    [Last N Weeks Sales],
    [Last N Weeks Sales],
    DESC
)

var priorPeriodRank=
RANKX(
    ALL('Product'[Product]),
    [Last N Weeks Sales (Prior Period)],
    [Last N Weeks Sales (Prior Period)],
    DESC
)
return IF(HASONEVALUE('Product'[Product]), priorPeriodRank - thisPeriodRank)
Last N Weeks Sales Rank in Prior Period =

var thisPeriodRank=
RANKX(
    ALL('Product'[Product]),
    [Last N Weeks Sales (Prior Period)],
    [Last N Weeks Sales],
    DESC
)

return IF(HASONEVALUE('Product'[Product]), thisPeriodRank)
