Skip to content
business intelligist

business intelligist

Let's get smarter together…

  • Home
  • KnowledgeBank.Pro
  • find us on youtube
  • COVID19 Dashboard
  • US Economic Indicators Dashboard

Month: March 2020

Coronavirus (COVID-19) Trends Analysis

March 31, 2020April 27, 2020 ~ Business Intelligist ~ Leave a comment

We are continuing to make enhancements to our Coronavirus dashboard (https://bit.ly/2voUAbx ). We have added a new tab that allows us to analyze mortality rates by country and by number of infected per 1M of population. This tab has yielded some interesting insight. You can learn more about it as well as some of my … Continue reading Coronavirus (COVID-19) Trends Analysis

New features are added to the Knowledgebank.pro COVID-19 (Coronavirus) dashboard

March 23, 2020April 27, 2020 ~ Business Intelligist ~ Leave a comment

  Lots of new features added to the dashboard.. also a video has been posted for those who need help with how to use it. Link to dashboard:     https://bit.ly/2voUAbx Link to video:               https://www.youtube.com/watch?v=T21h46ZDh14

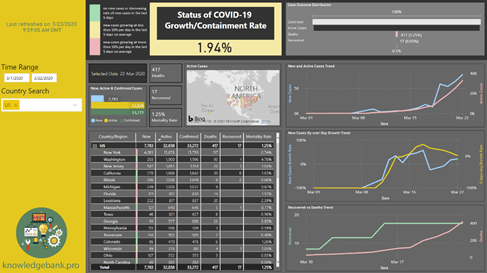
Coronavirus (COVID-19) Power BI Report

March 16, 2020April 27, 2020 ~ Business Intelligist ~ Leave a comment

Knowledgebank.pro has released a Power BI report with Coronavirus (COVID-19) statistics by Country/State. The data set is updated daily. You can find it following this link:

Archives

  • March 2021 (1)
  • February 2021 (5)
  • January 2021 (8)
  • December 2020 (2)
  • November 2020 (3)
  • October 2020 (1)
  • September 2020 (8)
  • August 2020 (9)
  • July 2020 (26)
  • June 2020 (16)
  • May 2020 (16)
  • April 2020 (8)
  • March 2020 (3)
  • May 2019 (1)
  • April 2019 (6)
  • December 2018 (1)
  • November 2018 (1)
  • March 2018 (1)
  • February 2018 (1)
  • January 2018 (2)
  • November 2017 (1)
  • October 2017 (1)
  • August 2017 (2)
  • May 2017 (4)
  • April 2017 (8)
  • March 2017 (6)
  • February 2017 (1)
  • January 2017 (3)
  • September 2016 (1)
  • July 2016 (2)
  • April 2016 (2)
  • March 2016 (1)
  • February 2016 (2)
  • November 2015 (3)
  • October 2015 (1)
  • September 2015 (3)
  • August 2015 (4)
  • July 2015 (8)
  • June 2015 (1)
  • May 2015 (2)
  • April 2015 (2)
  • March 2015 (6)
  • January 2015 (4)
  • December 2014 (2)
  • November 2014 (5)
  • August 2014 (5)
  • July 2014 (3)
  • May 2014 (4)
  • April 2014 (4)
  • March 2014 (4)
  • February 2014 (7)
  • December 2013 (1)
  • October 2013 (1)
  • July 2013 (1)
  • June 2013 (1)
  • May 2013 (3)
  • April 2013 (3)
  • March 2013 (3)
  • February 2013 (1)
  • January 2013 (1)
  • December 2012 (1)
  • November 2012 (4)
  • October 2012 (6)
  • September 2012 (5)
  • August 2012 (9)
  • July 2012 (9)
  • June 2012 (8)
  • May 2012 (14)
  • April 2012 (8)
  • March 2012 (25)

Categories

  • Analysis Services (17)
  • Azure (8)
  • Azure Data Factory (3)
  • Azure Data Lake (5)
  • Azure Data Warehouse (2)
  • business intelligence (12)
  • Cognitive Services (2)
  • COVID19 (14)
  • Custom Visual Review (6)
  • Data Persuasion (3)
  • Data Quality Services (2)
  • Dataflow (2)
  • DAX (61)
  • Designer (9)
  • Excel and Excel Services (34)
  • Finance (19)
  • Flow (2)
  • Integration Services (2)
  • Master Data Services (10)
  • Microsoft Business Intelligence (44)
  • News (6)
  • Office (25)
  • PerformancePoint (11)
  • Power BI (170)
  • Power Query (16)
  • PowerApps (8)
  • PowerPivot (38)
  • PowerView (51)
  • Q&A (2)
  • Reporting Services (15)
  • review (1)
  • Reviews (27)
  • SAP (16)
  • Self Service BI (28)
  • SharePoint (24)
  • SQL Server Database (15)
  • Storytelling (3)
  • This and That (31)
  • Tutorial (74)
  • US Economy (4)

Recent Posts

  • Dynamic Dropdown Navigation in PowerBI
  • Is Snowflake One Bad Quarter Away from Being Microsoft Power BI Biggest Threat?
  • What Kellogg Professor Got Wrong about Effectiveness and Honesty in Data Visualizations
  • Power BI Best Practices Analyzer in Tabular Editor
  • Progressive Discount (Tax or Commission) Calculation (Power BI DAX Tutorial)

AlwaysOn analysis services analytics Apple Azure Big Data BI Semantic Model bradcrumbs business intelligence Cloud Columnstore Index consumerization of IT dashboard Data Alerts Data Persuasion Data Quality Services Data Vizualization Data Warehouse DAX dynamic title Excel Services Gateway GeoFlow Hadoop Html5 Master Data Services Microsoft Microsoft Business Intelligence Microsoft Office Microsoft SQL Server Database Mobile Business Intelligence Office 15 Office 2013 PerformancePoint persuasion vs manipulation Power BI PowerBI Power Map PowerPivot PowerPoint Power Query PowerView Price Volume Mix PVM report Reporting Services Revenue Variance Analysis ROLAP Salesforce SAP Self Service BI SharePoint Slack SQL Azure SQL Server 2012 SSIS Surface T-SQL Tabular technology xVelocity
Follow business intelligist on WordPress.com

Top Posts & Pages

  • Price Volume Mix Analysis Using Power BI
  • Power BI: How to Implement Dropdown Navigation
  • Price Volume Mix (PVM) for Gross Margin Variance Analysis
  • Power BI & DAX: How to Make Waterfall Charts Work (showing starting and ending values)
  • What to Do When Power BI Totals are Wrong
  • Price Volume Mix (PVM) for Revenue Variance Analysis
  • DAX for Perfect Price Volume Mix (PVM) Calculation (Power BI Tutorial)
  • Power BI Tutorial: Dynamically update Date slicer to show Current Date
  • Power BI Tutorial: Generate ID field using Power Query
  • Enabling Power View in Excel 2016
Blog at WordPress.com.