

EDIT 2020-12-14: the final installment of the three part series on PVM with DAX formulas and the latest video can be found here: https://businessintelligist.com/2020/12/11/dax-for-perfect-price-volume-mix-pvm-calculation-power-bi-tutorial/
EDIT 2020-11-20: the most recent post about this topic, including a video, can be found here:https://businessintelligist.com/2020/11/20/the-definitive-guide-to-price-volume-mix-calculation-pvm-in-power-bi-theory/
EDIT: 202-04-24: I have made some additions to the original post, please see the theory behind the calculations in the link below:
https://businessintelligist.com/2020/04/24/price-volume-mix-pvm-for-revenue-variance-analysis
Also, if you would like to know how to calculate PVM for Gross Margin analysis, you can follow this link: https://businessintelligist.com/2020/04/26/price-volume-mix-pvm-for-gross-margin-variance-analysis
I have also recorded a video about the subject here:
The original post continues below:
Traditionally, when we do variance analysis, we compare the actual value of the metric being measured to its target value in either absolute or relative terms. For example, if I were to compare current year sales (Sales CY) to prior year sales (Sales PY) I might want to create a Sales YoY calculation as well as a Sales YoY % calculation. A vast majority of companies do not go much further than that, as they use these two variables as well as the original two (Sales CY and Sales PY) to either trend or scatter plot them using either Product, Division or Time lenses in chart’s Axes or Series.
Price Volume Mix variance analysis adds a little bit more sophistication to the aforementioned approach as it enhances our initial analyses by decomposing how volume or pricing changes of our product assortment contributed to the difference in performance between the actual and target values.
Traditionally, Price Volume Mix analysis has the following three components:
- Price Impact = Target Volume * (Actual Price – Target Price)
- Volume Impact = Target Price * (Actual Volume – Target Volume)
- Mix Impact = (Actual Volume – Target Volume) * (Actual Price – Target Price)
[EDIT 2020-12-14: there is also a different approach to the PVM calculation that is very popular in FP&A analysis that can be found here (including a video) : https://businessintelligist.com/2020/12/11/dax-for-perfect-price-volume-mix-pvm-calculation-power-bi-tutorial/
This approach uses different logic for calculations:
PRICE IMPACT = Volume TY * (Price TY – Price LY)
MIX IMPACT = Units TY Mix Gain * (Price LY – AVG Price LY)
VOLUME IMPACT = (Vol TY – Vol LY) * Avg Price LY +
(Price LY – AVG Price LY) * (VoL @ LY Mix – Vol LY)
Please follow the link above if you would like to learn how that approach works as well. END OF EDIT]
I will add some additional insight to our calculation and introduce two more components to the mix:
- New Products Impact = Actual Sales of products that were not present in the Target scenario
- Discontinued Products Impact = Target Sales of products that were present in the Target scenario but we did not get any actual sales for the time period being analyzed
A cursory search of the interwebs regarding the latter two lenses into the variance impact did not yield any content; therefore, I feel that I can claim both thought-leadership for myself 🙂 and also tool leadership for Power BI as it enables such a powerful path of variance examination.
Even though this is a level 300 article, the data set that we will use here is extremely simple:
| Date | Product | Revenue | Volume |
|
1/1/2015 |
D1 |
1000 |
10 |
|
2/1/2015 |
D1 |
1000 |
10 |
|
1/1/2015 |
P1 |
3500 |
10 |
|
1/1/2016 |
P1 |
4000 |
17 |
|
1/1/2016 |
N1 |
1000 |
10 |
As you can see, we have sales history of three products D1, P1 and N1 (in this naming convention D stands for Discontinued and N stands for New just so it’s easier to test and follow the logic). In other words, we only sold D1 in 2015 and we only sold N1 in 2016 where as we Sold P1 in both 2015 and 2016. So, in our example we will use year 2016 as Actual and year 2015 as Target.
Because this is a level 300 lab, I will not be providing step by step instructions; I will, however, provide all of the DAX logic that is necessary to implement this solution (the sample file is available to download at the end of the article)
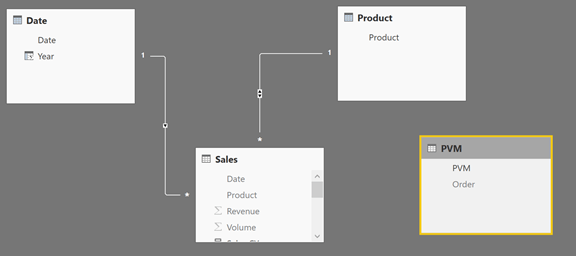
Create Date and Product tables
Frankly speaking, the only table that we really need in addition to the Sales table is Date because it is required to implement time intelligence logic. I did create a Product table as well simply to illustrate how one might use DAX to do it.
Product Table: Product = VALUES(Sales[Product])
Date Table: Date = CALENDAR(“1/1/2015”, “12/31/2016”), then add a Year field: Year = YEAR(‘Date'[Date])
I also created an “Enter Data” table by pasting in the following:
|
PVM |
Order |
| Price | 1 |
| Volume | 2 |
| Mix | 3 |
| New Products | 4 |
| Discontinued Products | 5 |
After that I linked my Sales table with Date and Product.
Basic measures
Sales CY = SUM(Sales[Revenue])
SalesPY = CALCULATE(Sales[Sales CY], SAMEPERIODLASTYEAR(‘Date'[Date]))
SalesYoY = Sales[Sales CY] – Sales[Sales PY]
VolumeCY = SUM(Sales[Volume])
VolumePY = CALCULATE([Volume CY], SAMEPERIODLASTYEAR(‘Date'[Date]))
PriceCY = DIVIDE(Sales[Sales CY], [Volume CY])
PricePY = DIVIDE(Sales[Sales PY], [Volume PY])
These measures should be self-explanatory for a 300-level lab.
Price Volume Mix variance calculation
The basic flow of this calculation is the following:
-
We create local variables that calculate Pricing, Volume, Mix, New Products and Discontinued Products impact
- For Pricing, Volume and Mix calculations, we need to make sure that we are only considering products that have sales this year and prior year. To do that we use AddColumns() function to get a list of all products and then add relevant data to each product record to calculate necessary impact. Checking for Blank value for price current year or prior year insures that in these calculations we only analyze products that had both current and prior year sales
- New products logic is very similar other than we check that no prior year sales exist
- Discontinued Products logic is basically a cheat – we solve for it by subtracting the other variables from the Sales YoY variance.
- We use Switch() function to check for the selected member in the PVM table that would be adding to the Category of the Waterfall Chart and then we return the corresponding local variable
The final Price Volume Mix calculation is listed below:
Price Volume Mix =
VAR PriceImpact =
SUMX(
ADDCOLUMNS(
VALUES(‘Product'[Product]),
“Price”, ([Volume PY])
* (
IF(
ISBLANK([Price PY]) || ISBLANK([Price CY]),
0,
[Price CY] – [Price PY]
)
)
),
[Price]
)
VAR VolumeImpact =
SUMX(
ADDCOLUMNS(
VALUES(‘Product'[Product]),
“Volume”, (
IF(
ISBLANK([Price PY]) || ISBLANK([Price CY]),
0,
[Volume CY] – [Volume PY]
)
)
* ([Price PY])
),
[Volume]
)
VAR MixImpact =
SUMX(
ADDCOLUMNS(
VALUES(‘Product'[Product]),
“Mix”, IF(
ISBLANK([Price PY]) || ISBLANK([Price CY]),
0,
([Price CY] – [Price PY])
)
* ([Volume CY] – [Volume PY])
),
[Mix]
)
VAR NewProductImpact =
SUMX(
ADDCOLUMNS(
VALUES(‘Product'[Product]),
“New”, IF(ISBLANK([Sales PY]) || [Sales PY] = 0, [Sales CY], 0)
),
[New]
)
VAR DiscontinuedProductImpact = Sales[Sales YoY] – VolumeImpact – NewProductImpact – PriceImpact – MixImpact
RETURN
SWITCH(
MAX(PVM[Order]),
1, PriceImpact,
2, VolumeImpact,
3, MixImpact,
4, NewProductImpact,
5, DiscontinuedProductImpact,
BLANK()
)
You can download the sample here.

This is very helpful. I wanted to download this sample file, but nothing happens when I click on it. It the link working properly?
I will take a look tonight and make sure it works
the link works for me, can you try it again?
It’s working now! Thanks.
On Wed, Apr 5, 2017 at 9:45 AM, business intelligist wrote:
> Business Intelligist commented: “the link works for me, can you try it > again?” >
Brilliant article. However, it’s an industry wide established practice to calculate Price Variance on Actual volume than Target volume. Kindly refer the following article:
https://www.linkedin.com/pulse/variance-analysis-volume-mix-price-fx-rate-umit-coskun
I could be misunderstanding your question/comment, but by definition, when we do variance analysis we trying to determine how well we did relative to our expected or target value, so we multiply target volume on difference in price and then target price in difference in volume.
in the vpcm calc, determining price or cost variance is the only one that is straightforward.. (actual price – target price) * Actual volume… you don’t multiply by the target volume. Also, the way the formula is built for volume is directional correct but not 100% accurate… it does include portion of the mix.. The mix formula mentioned above needs to be revised too
Hello,
Deepak is right, by definition we use target price when we caclulate volume impact, and actual volume when price impact.
You can find the details of calcuations whith all explanations with the links below :
https://www.accountingtools.com/articles/what-is-variance-analysis.html
https://www.myaccountingcourse.com/accounting-dictionary/variance-analysis
But at the same time somebody uses your methode :
https://www.accountingcoach.com/blog/what-is-variance-analysis
Any ideas why people use different methods ?
Thank you!
I think the question is what two variables we are trying to bridge. This year number vs last year number, forecast vs actual, etc. So if I compare this year to last year, then I would hold one of the drivers from last year (like price) and analyze the change in the other driver year over year (like volume) etc.
hello, how can I open a PBIX file?
This is exactly what I was looking for. Great article and thank you for providing the downloadable example. How would you perform this with multiple levels in a hierarchy where all the calcs are performed at the Product level and then sum up to a Product Line level and then Product Lines sum to create Categories. This would be done in Tableau using a LOD function.
Thanks again.
Hi, really like the implementation of this in Power BI. One question, generally I consider mix to be a shift of volume to either a more expensive or cheaper product. Consider this example:
Product Date Revenue Volume
P1 1/01/2015 20 20
P1 1/01/2016 40 40
P1 1/01/2017 60 60
P2 1/01/2015 36 180
P2 1/01/2016 32 160
P2 1/01/2017 28 140
The price for P1 stays constant at $1 and the price for P2 stays constant at $0.20. The volume increases for P1 while the volume for P2 decreases however their combined volume remains constant at 200 units. This shift in volume results in an increase in revenue. When I put this data into your example only the volume showed a change while the mix remained at 0. Can you think of a way to represent this as a change in mix rather than a change in volume?
Hi,
This is extremely helpful. Thank you so much for posting this. Do you know if I can create a similar analysis framework to analyze gross margin variance? In other words, gross margin change due to price change, raw material cost change, shipping cost change, new product, discontinued product and product mix. Any guidance you can provide is highly appreciated.
Hi Fabio,
I am also looking at the analysis you mentioned in your comment.
Have you had any tip?
I like your approach, but as Jason mentioned in his post above, the mix and volume variances’ calculations don’t make sense.
It probably should be:
Mix Variance = (old product / old volume all products) * (new volume product / old volume all products) * (New Vol – Old Vol)*Old Price
Volume variance = (New Vol – Old Vol) * Old Price – Mix Variance
i think the correct PVM formula should be as follows
Price Var (Pcy-Ppy)*Vpy
Vol Var (Vcy-Vpy)*Pcy – Mix
MixVar (Vcy – Vpy)*Pcy*[(Vcy/VcyTOT)-(Vpy/VpyTOT)]
Where, cy – current period, and py – prior period, TOT – sum total for the period
Hi. This is great. I have learned from it and downloaded and applied it on my own work. I was wondering if its possible to have this linked. What I mean is if I click on one of the variances in the waterfall, that then it filters on my other tables to show me only the specific customer (i replaced your product view by customer) on my tables which have all the data.
This is great!, Thanks for the post and for uploading the doc! I replicated this and it has worked!. However, I have put the chart and a table below showing the products and numeric data of interest to complement the analysis and when I wanted to filter something from the chart it doesn’t worked as expected (for instance, I want to click on the “New products” bar and get the table filtered showing only those products with the details. I reviewed the Interactions and they are ok. What am I doing wrong?
This is very interesting and something I have been struggling to get up and running! I need a consultant to help with implementing PVM in Power BI in my business. Do you do any consultancy/freelance work?
Great info! I’m however having trouble to get the yearly information correct when a product is diversified mid year and there has been a price change. The months calculates correctly but the yearly value is not a sum of the months as it is calculated just the same as the months. Is there a way to handle that?
In lack of response, I created some SQL that calculates the volume/price components correctly. Still using the Powerpivot for the analysis (where the full year is a sum of the months and not a calculation).
I figured out how to do this correctly! I’m open for consultancy/freelance work in July.
Super interesting…will it be possible to throw in a level of extra complexity adding a geography dimension with multiple countries. The ADDCOLUMNS plays tricks on my when working with two separate dimension from two tables?
I got stuck in the same problem, did you find a solution to this?
Very interesting,
How can I showcase the following:
Column A: Should be the Full Year of April 2018, i.e.: base line
… and then the bridge in between as you show in this article.
Column B: Sum of all the previous resulting in FY April 2019 Sales.
I’ve been using a pretty similar model as well. But sometime i found it hard to explain to the model users the mix portion of the equation. Any ideas how to further decompose the mix component into market segment mix, channel mix and regional mix ? I assume it would change the volume variance as well?
Hi, thanks for sharing the file. I’ve successfully made the similar chart following your article.
I’m wondering how can I adopt this chart to a waterfall chart that has PY and CY bars? So, the most left bar is PY, the middle bars are Price, Volume, Mix, New Products, Discontinued Products, and the most right bar is CY.
Thanks
i highly appreciate your useful article. It makes my day. Btw, just one step further, please help me how can I filter by product (N1,P1,D1) as your model? please help me .
Your Volume and Mix analysis here is way too complicated . . . and, actually, it is incorrect. The correct answer for Volume and Mix analysis is mathematically (with “proofs”) very simple. We don’t have to be forced to worship a script calculation simply because it is done in BI. In terms of basic concepts, an Excel spreadsheet is more than sufficient. I would like to see you explain this analysis to top level management . . . lots of luck on that one! If you are really interested in the correct solution for Volume and Mix analysis, take a click on http://www.volume-and-mix-analysis.com/.
Hi
First of all, let me clarify that I am using power query and power pviot for sales analysis and have imported sales register in the data model and created a calendar. Now I want to calculate the price and volume variance calculation so that I can run the sales analyses using various cuts.
About the data:
I have a sales data which has detailed transaction level details wherein the details are available date wise, invoice-wise, product-wise. I want to do the PV analyses at product code level and then aggregate it at various levels (product category, market segment, customer segment etc).
Please help me writing a DAX measure for price volume analyses. I tried writing DAX measure to calculate the “sum of product-wise sales value” and “sum of product-wise sales quantity”. Similarly I can write previous year formula if I know this. Further, using these numbers I can calculate average price for current year and Previous year and then can calculate Price variance at product level. Volume variance I can put as balancing number (i.e. ([Product-wise sales value of current year] – [Product-wise sales value of previous year]) – Price variance at Product level)
Appreciate if someone can help with this as I struggled to find solution for last couple of days.
i have the same question… not sure if you have solved it, i tried to write DAX but at certain points the calculations are not showing right results, i use customer product level data, not only product
Hi Victor, Were you able to solve this?
This is probably a stupid questions…
how can i sort the labels on the chart?
Your are showing:
Price – Volume – Mix – New Products – Discontinued products – Total
Mine shows:
New Products – Mix – Price – Disc.Prod – Volume – Total
Also you are filtering by year 2016 in your pbix. Any reason in particular ?
I have my data with “Last Year” “This Year” not 2016 2017.
Ok so on the visual we had to click the three dots and sort by PVM.
Thanks a lot Business Intelligist. A lot of complex things going on here but this chart is invaluable for my pricing analysis!
Ill be sure to watch your blog, this is amazing.
Kudos!
about DATA, can it be done at customer product level ? instead of only at product level. With customer and products, there will be additional dimensions related to them to use as filter of course.