
Slice and Dice experience on a table with multiple dates can be a little frustrating. If I have two date tables connected to my two date columns in the transaction table (so if I have a list of projects, Project Start Date and Project End Date), and if I create two filters at the same time, the user will have to constantly clear one filter to use the other and vice versa. The solution is to NOT connect the filter tables to the transaction table and use the TREATAS() function to govern the end user experience.
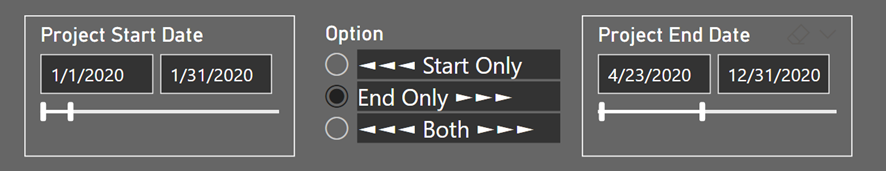
In our case, we want to let the user use the Project Start Date as a filter, OR, Project End Date as a filter or BOTH. (I call it Slice and Dice on steroids)
You can download the Power BI model here.
Budget =
SWITCH(SELECTEDVALUE('Filter Options'[Option Sort], 1),
    1,
    CALCULATE(
        SUM(Project[Budget]),
        TREATAS(VALUES('Project Start Date'[Date]), Project[Project Start])
    ),
    2,
    CALCULATE(
        SUM(Project[Budget]),
        TREATAS(VALUES('Project End Date'[Date]), Project[Project End])
    ),
    3,
        CALCULATE(
            SUM(Project[Budget]),
            TREATAS(VALUES('Project Start Date'[Date]), Project[Project Start]),
            TREATAS(VALUES('Project End Date'[Date]), Project[Project End])
        )
)
# of Projects =
SWITCH(SELECTEDVALUE('Filter Options'[Option Sort], 1),
1,
CALCULATE(COUNTROWS(Project),
TREATAS(VALUES('Project Start Date'[Date]), Project[Project Start])),
2,
CALCULATE(COUNTROWS(Project),
TREATAS(VALUES('Project End Date'[Date]), Project[Project End])),
3,
CALCULATE(COUNTROWS(Project),
TREATAS(VALUES('Project Start Date'[Date]), Project[Project Start]),
TREATAS(VALUES('Project End Date'[Date]), Project[Project End]))
)