
Data for the tutorial can be obtained by downloading the following files:
Step 1: Load Sales Data to Data Model
- Open workingwithcurrency.xlsx, highlight Sales Data table, pick PowerPivot from the ribbon and select Add to Data Model
Step 2: Using Power Query to transform Exchange Rate data
- Exchange rate file has unwanted rows on the top and bottom of the file and data needs to be un-pivoted
- Click on Power Query on the ribbon in workingwithcurrency.xlsx
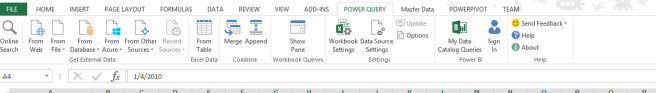
- Click on “From File” and select “From Excel”
- Browse and select Exchange Rate file. This will load the file into the Navigator (right side panel)
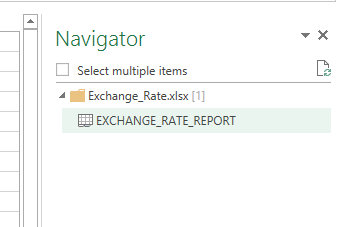
- Right click on “EXCHANGE_RATE_REPORT” and select Edit to open Power Query editor
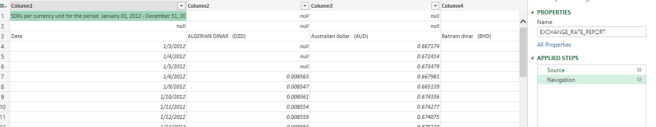
- Right click on the first cell and select “Filters -> Does not equal” to remove the first row
- Right click on the first cell and select “Filters -> Does not equal” to remove the next row
- Highlight the first row and select “Use First Row As Headers”. File should look as below
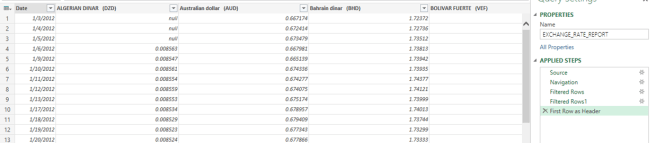
- Highlight Date column and change data type to Date
- Highlight Date column and click on Remove Errors. This will remove any rows that are not of data type Date
- Highlight Date column, click on Transform tab in the ribbon and select Unpivot Columns -> Unpivot Other Colums. This will unpivot all the currency columns
- Right click on Attribute column and rename it to Currency
- Right click on Value column and rename it to ExchangeRate
- Rename the query to Exchange Rate
- Close and Load to Data Model
Step 3: Using Power Query to create Date table
We will use the Sales Data to create Date table
- Click on the Sales Data sheet, highlight the data and from the ribbon select Power Query -> From Table. This opens Power Query editor
- In the editor rename the query to Date
- Right click on Revenue column and select Remove
- Highlight Date column and change data type to Date
- Highlight Date column and select Remove Duplicates
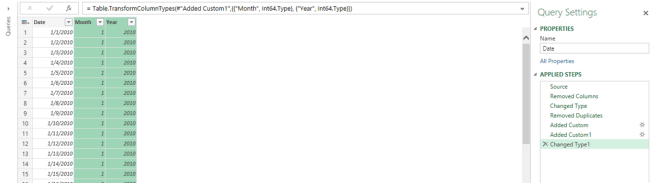
- From the ribbon select Add Column. A window will open, name column to Month and use formula = Date.Month([Date])
- From the ribbon select Add Column. A window will open, name column to Year and use formula = Date.Year([Date])
- Highlight Month and Year column and change data type to Whole Number
- Close and Load to Data Model
Step 4: Using Power Query to create Currency table
We will use Exchange Rate file to create Currency table.
- Select Exchange Rate file as the source for the Power Query
- Follow steps as before and until currency is unpivoted and attribute column is renamed to Currency
- Click on Currency column and select Remove duplicates
- Highlight Currency column, right click and select Remove Other Columns
- Rename query to Currency
- Close and Load to Data Model
Step 5: Create Measures using Power Pivot
- Open the Power Pivot model by clicking on PowerPivot -> Manage on the ribbon
- Create relationships as shown below
-
Mark Date table as Date

-
Open Sales table and create following measures
Sales$:=SUM([Revenue])
Sales$ EX:=IF(HASONEVALUE(Currency[Currency]), SUMX(ADDCOLUMNS(Sales, “EXRevenue”, [Revenue]*LOOKUPVALUE(‘Exchange Rate'[ExchangeRate], ‘Exchange Rate'[Date], Sales[Date], ‘Exchange Rate'[Currency], VALUES(Currency[Currency]))), [ExRevenue]), [Sales$])
-
Format Sales$ as currency and Sales$ Ex as a decimal number
Here is a pivot table report:
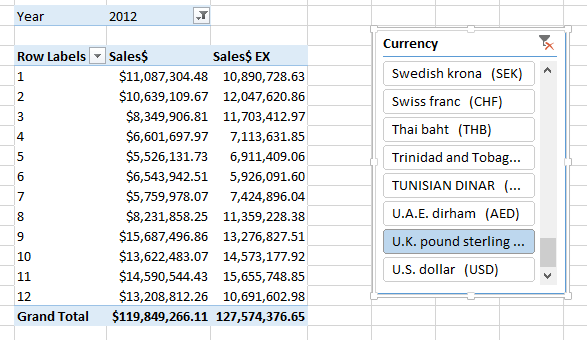
** Exchange rate file does not have data for weekends and holidays. Future post will explain how to handle this scenario

Hi! great article, but can you add Exchange Rate File so I will be able to repeat it step-by-step? Thanks in advance!
Hi! Great article! But can you provide the Exchange Rate File so I can repeat all these step-by-step? thanks in advance
Exchange Rate File is posted
Works like a charm, thank you very much!
HI, Thank you for the above solution, do you know how should I approach if I have data in different currency and I want to convert values like the above example, to a “user selected” currency using a filter.
I have a table which have sales revenue for companies from different countries, it also includes information about currency (the revenue is reported in) and reporting date (which in this case could become the currency conversion date)
now I also have a separate table which includes information on dates, exchange rates, original currency & user selected currency (only 10 choices). Is there a way I can make this work.
Really a great tutorial but I lost you at this step “Follow steps as before and until currency is unpivoted and attribute column is renamed to Currency” – I am really new to all of this.
This is really helpful, however, my Sales$ and Sales$Ex measures are both reporting back the same data but I can’t figure out why. Does anyone have any thought on what I might have done wrong?
Is the follow up post already available?
“** Exchange rate file does not have data for weekends and holidays. Future post will explain how to handle this scenario”