
EDIT: 2021-03-08 – An updated Power BI Desktop File and a video on this topic can be found here: https://businessintelligist.com/2021/03/08/market-basket-analysis-power-bi-dax-tutorial/
It’s been almost two years since I posted about the CONCATENATEX() DAX function here. At the end of that post I promised to publish a tutorial on how one might do Market Basket analysis using this function in Power BI. Well, I try to deliver on my promises even though it might take me two years to get there.
Please download the Zip file with the Market Basket Analysis model here.
Let’s walk through the data first… Initially, we have two tables in our model, Sales and Product. The Sales table has every customer transaction, what products where part of the transaction and also quantity sold.
The product table has the Price and Cost information about the product that we will use to analyze size and profitability of our Market Baskets

After we have the two tables loaded and related by Product ID, we can start enhancing the model.
The first order of business is to assign our sales transactions into Market Baskets. To do that, we need to create a new field on the Sales table. We will identify a market basket as a string of all Product IDs in that basket separated by “-” character. The code to add the Market Basket field to the Sales table is below:
Market Basket =
CALCULATE(
CONCATENATEX(Sales, Sales[Product ID], “-“ ),
FILTER(
ALL(Sales),
Sales[Transaction ID] = EARLIER(Sales[Transaction ID])
)
)
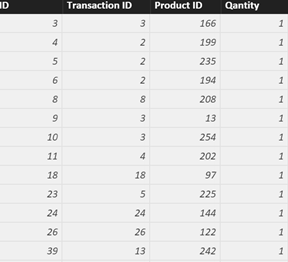
Now our Sales table will look like the image below (please note that records with the same Transaction ID have the same value for the Market Basket)

While we are in the Sales table, we can add Sales, Cost, Margin and Margin% fields to it so we can do sales and margin analysis of individual products.
Sales = Sales[Quantity] * RELATED(‘Product'[Price])
Cost = Sales[Quantity] * RELATED(‘Product'[Cost])
Margin =Sales[Sales] – Sales[Cost]
Margin % = DIVIDE(Sales[Margin], Sales[Sales])
(Please note that you should create a calculation for Margin %, I am using this field for demonstration purposes only)
The next step is to create the Market Basket table. To do that, make sure you are in the Report view then click on Modeling->New Table. The code to create the new table is below:
Market Basket = DISTINCT(Sales[Market Basket])
Now we need to make sure that all of our tables are properly related
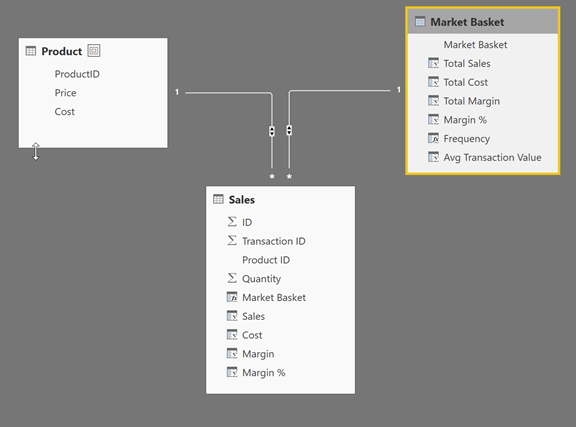
After that, we can add additional fields to the Market Basket table that will help us with our analysis:
Total Sales = SUMX(RELATEDTABLE(Sales), RELATED(‘Product'[Price]) * Sales[Quantity])
Total Margin = ‘Market Basket'[Total Sales] – ‘Market Basket'[Total Cost]
Total Cost = SUMX(RELATEDTABLE(Sales), RELATED(‘Product'[Cost]) * Sales[Quantity])
Margin % = DIVIDE(‘Market Basket'[Total Margin], ‘Market Basket'[Total Sales])
Frequency = COUNTX(RELATEDTABLE(Sales), Sales[Market Basket])
Avg Transaction Value = DIVIDE(‘Market Basket'[Total Sales], ‘Market Basket'[Frequency])
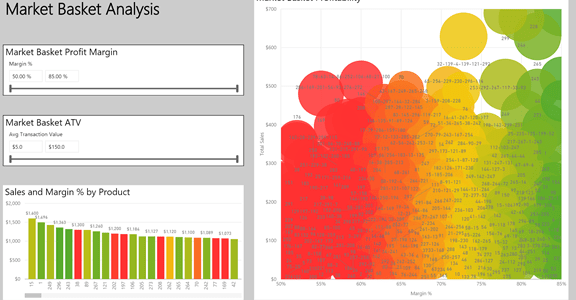
With all the necessary calculated elements in place, our model is ready for analysis. Please note that this is obviously a simplified case of Market Basket analysis, but hopefully it demonstrates the power of CONCATENATEX() and some of the capabilities that it enables.
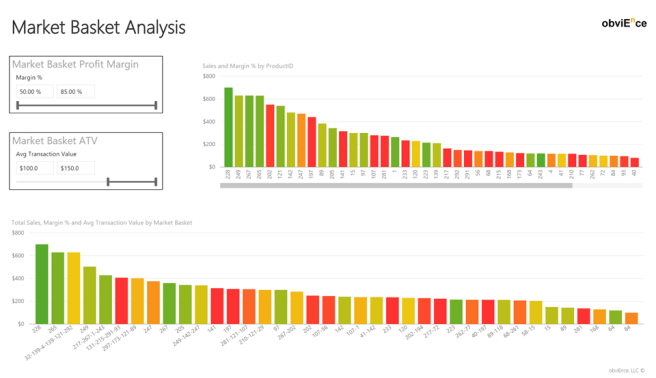
You can play with the slicers to zero-in on market baskets with specific profitability and Average Transaction Value and then explore which products are part of it… The trick question is this – How can you enhance the dataset and the model so that we can start analyzing which products are good candidates to be sold on promotion because they pull through very profitable Market Baskets?

Thanks for this great example!
I have another question. I want to return all unique product combinations. In the current situation the result returns 2 product combinations, for example transaction X = A – B and transaction Y = B – A.
This is practically the same product combination. Do you have any idea how to return only the unique combinations, so in above example only product combination A – B is returned?
Thanks a lot!
Dave
this can be solved by making sure that the data is sorted as it’s being loaded from the source in Power Query
Thanks for the solution here. Can you please elaborate on the steps to sort? Also, I noticed that my frequency totals per market basket are exactly twice what they should be. I wonder if it’s related to this question.
Congratulations!
Thank you for sharing! It is useful for me.
Thank you so much great work, can you explain if possible how to get the following parts of the market basket analysis: support, confidence and lift ?
I have done a lot of work with calculating lift.. there are several approaches, some require R and knowledge of statistics, others can get a fairly good approximation using just DAX. I am hoping to find some time over the next few weeks to put it down on paper but with my schedule being as busy as it has been lately, it might take me a little while to get to it
Another thing I want to know Is the transaction id means the Order id? or it is a transaction in the shop e.g.(Supermarket)?
since we have one product per records in the sales table, transaction id is the attribute that allows us to group products that were purchased together in the same trip. I am guessing it is the same as your Order ID
Please we need more information about the structure of the tables in particular Sales table
I implemented it on my DB, I found a problem in using (EARLIER) function in one transaction separated by (-) some of the Products (Items) duplicated, how can we solve this problem?
you may have to do some cleanup in power query before data gets loaded to make sure that there are no dupes or create a better composite key that will ensure that you don’t have any duplicates
Can I send you the DB to look for it?
Hi, I need some help.
I am trying to use the same Market Basket analysis in the way you did it. The only thing that changes is the name of the columns, but as soon as I create the Market Basket column with the code you referred, I got this error message:
The syntax for ‘)’ is incorrect. (DAX(CALCULATE(CONCATENATEX(Sales, Sales[Descripción], – ),FILTER(ALL(Sales),Sales[Número Factura] = EARLIER(Sales[Número Factura]))))).
I have checked it over and over and I can´t see what is wrong
The code that I am using is the following:
Market Basket = CALCULATE(
CONCATENATEX(Sales; Sales[Descripción]; – );
FILTER(
ALL(Sales);
Sales[Número Factura] = EARLIER(Sales[Número Factura])
)
)
Any help would be appreciated
First a calculated column must be made and not a metric, second the calculated column must be within the table where you are referenced in the filter. This will solve.