
I have decided to spend some more time on Market Basket Analysis, but before I get into the storytelling part of it, I had to clean up and fix a few things in the model file for the Market Basket Analysis that I created a few years ago.
Market Basket Analysis is very important as retailers and CPG companies try to understand consumer behavior, particularly when it comes to deciding which products should be promoted, as the hope is that although we might be taking a margin hit on the promoted product, the rest of the products that we are hoping will get purchased in the same market basket will hopefully more than compensate for the cost of promotion.
You can download the updated model here.
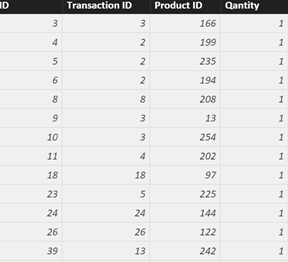
Let us walk through the data first… Initially, we have two tables in our model, Sales and Product. The Sales table has every customer transaction, what products where part of the transaction and also quantity sold.
The product table has the Price and Cost information about the product that we will use to analyze size and profitability of our Market Baskets

Market Basket =
CALCULATE(
    CONCATENATEX(Sales, Sales[Product ID], "-"),
    FILTER(
        ALL(Sales),
        Sales[Transaction ID] = EARLIER(Sales[Transaction ID])
    )
)
After we have the two tables loaded and related by Product ID, we can start enhancing the model.
The first order of business is to assign our sales transactions into Market Baskets. To do that, we need to create a new field on the Sales table. We will identify a market basket as a string of all Product IDs in that basket separated by “-” character. The code to add the Market Basket field to the Sales table is below:
Now our Sales table will look like the image below (please note that records with the same Transaction ID have the same value for the Market Basket)

While we are in the Sales table, we can add Sales, Cost, Margin and Margin% fields to it so we can do sales and margin analysis of individual products.
Sales = Sales[Quantity] * RELATED(‘Product'[Price])
Cost = Sales[Quantity] * RELATED(‘Product'[Cost])
Margin =Sales[Sales] – Sales[Cost]
The next step is to create the Market Basket table. To do that, make sure you are in the Report view then click on Modeling->New Table. The code to create the new table is below:
Market Basket = DISTINCT(Sales[Market Basket])
Now we need to make sure that all of our tables are properly related:

You can find the additional DAX calculations used in the model below:
Total Sales = [Sales]
Total Cost = SUMX(RELATEDTABLE(Sales), RELATED('Product'[Cost])*Sales[Quantity])
Total Margin =
'Market Basket'[Total Sales] - 'Market Basket'[Total Cost]
Transactions = DISTINCTCOUNT(Sales[Transaction ID])
Avg Transaction Value =
DIVIDE(
    'Market Basket'[Total Sales],
    [Transactions]
)

Thank you very much for this excellent demonstration on market basket analysis. In practice, one would want to know the basket by product name and not product ID
Agreed… this is just a test dataset, but i should probably make up some product names for the follow up videos
Thanks for the video and the explanation. Really great work.. I wonder, have you made any related videos on the Market Basket analysis?
Thank you for this video. That made this analysis very simple. I have one question. For lines where there is a quantity more than 1, is there a way to have that Product ID repeated. For Example, in Transaction ID 2 – can the “Market Basket” Column read – 199, 235, 194, 227, 227, 227, 89, 89, 89 – since item 227 and 89 were each purchased in a quantity of 3?
I am still learning Power BI and Dax.
Thanks!!
I have one other question. I have run my analysis on my data, but I am getting duplicates. Using the video example, the order of the basket matters. A basket of 199,235 is distinct from a basket of 235,199. Is there a way to have this output as a basket count of 2, instead of a basket count of 1 and then another basket count of 1?
Thanks!