
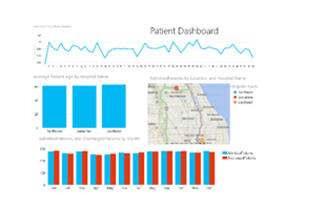
 Let’s take a look at an unfortunately very familiar to most of us business scenario. A patient gets admitted to a hospital, spends several days there and then gets discharged (hopefully feeling much better 🙂 ). In this situation, we have two dates that describe this event, the date of being admitted and the date of being discharged from the hospital.
What is the best way to model this in your reporting model (Power Pivot or Analysis Services Tabular)?
It is not uncommon for someone new to Microsoft BI to model this using two identical Date dimensions similar to the picture below:
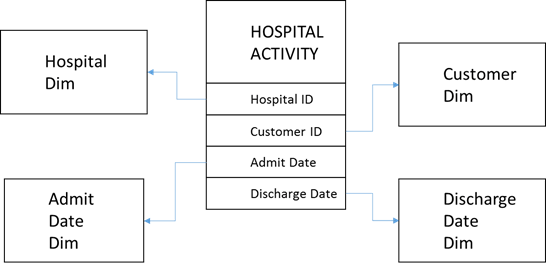
Although in many BI tools, this seems to be the only option to model our use case, this design would be much more user friendly if we found a way to use a single Date dimension for our model. This tutorial will walk you through all the necessary steps to meet this objective.
Please find the Tutorial Data File here.
Step 1 – Create Model
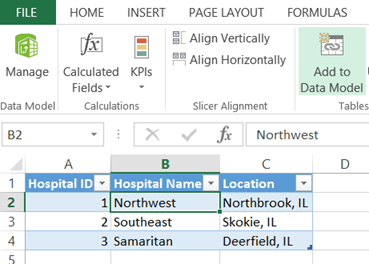
In this tutorial, I am assuming a certain level of Power Pivot experience, so I will not explain very basic concepts. The Excel file that we’ll use in this tutorial has four data sheets with an Excel Table on each tab. We have tables for the following:
- Hospital
- Customer
- Date
- Fact (or hospital/patient activity)
First, let’s add all four tables to a Power Pivot model by clicking on each table and then clicking on PowerPivot-> Add to Date Model ribbon button
Make sure do to that for all four tables so that when you click on PowerPivot->Manage you see the following:
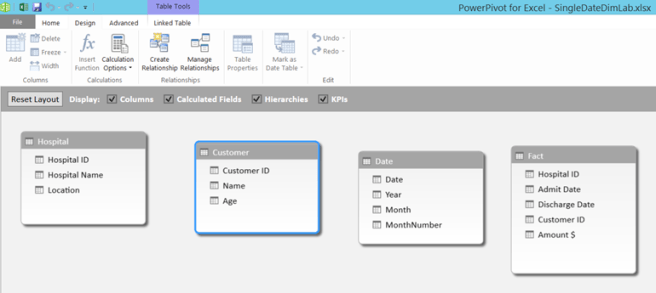
Now let’s link our Fact table with our Dimensions by dragging ID fields from the Fact table into the corresponding ID fields in the respective Dimension tables.
NOTE that Admit Date and Discharge Date will both link to the same Date field in the Date table. Your end result should look like this:
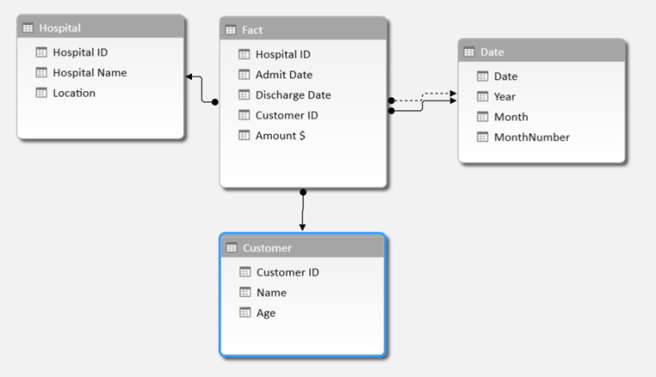
As you can see, there are two arrows connecting our Fact and Date tables, one is solid and one is not. If you go to PowerPivot->Design->Manage Relationships you will see that relationship corresponding to the dotted line arrow is marked as Inactive (in my case I created Admit Date -> Date relationship first, so it is marked as Active)
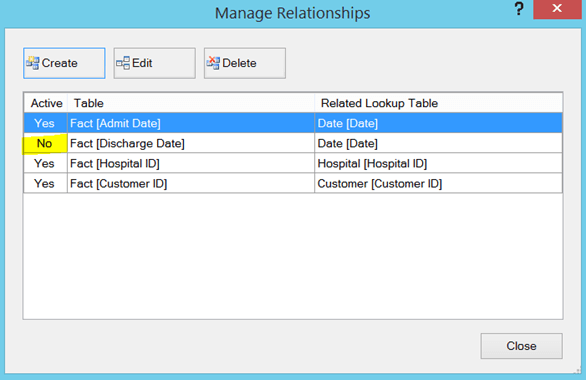
This means that by default, when a user filters on Date dimension, the facts will be filtered using Admit Date column in the fact table. Click Close, as we are now ready to enhance our model and make it more user friendly for analysis.
Step 2 – Enhance Model
If you are still in the Diagram View, click on Data View and then click on Hospital tab. We want to hide all of the ID fields as they will be meaningless to end users. Click on Hospital ID field, right click on it and then select “Hide from Client Tools” option. Do the same for the Customer ID field on the Customer tab.
Now, let’s add a Week Number column to our Date dimension. Click on the Date tab, then Add Column and type =WEEKNUM([Date]) to calculate the number of the calendar week in the year and hit Enter.
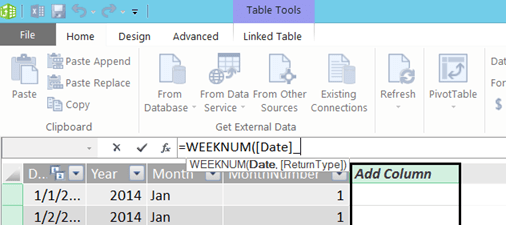
Right click on the newly created column and pick “Rename Column” option, name the column Week Number.
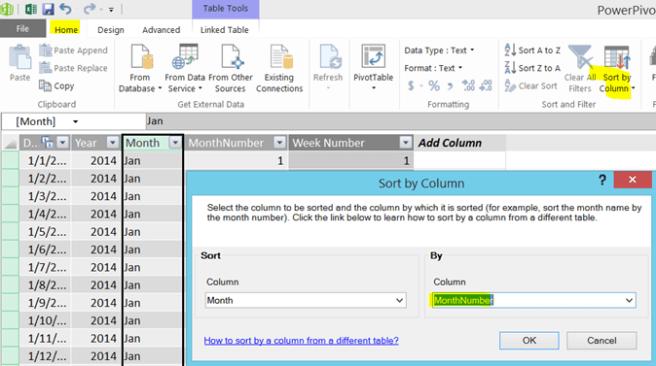
The last thing to do in our Date dimension is to make sure our Months are properly sorted. Click on Home->Sort By Column and make sure that Month is sorted by Month Number column
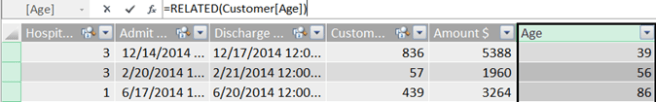
Now let’s click on the Fact tab, Add New column and bring the corresponding customer age from the Customer table by typing the following in the function field =RELATED(Customer[Age]), then rename the new column as Age
Highlight all columns in the Fact table, right click and hide them from client tools.
Step 3 – Create Calculations
Let’s create the easy calculations first. I assume that you know how to create new calculations as we covered that in our previous tutorials. Go ahead and add the following:
- DistinctPatientCount:=DISTINCTCOUNT([Customer ID])
- Average Patient Age:=AVERAGE([Age])
Now things get a little more interesting as we will have to consider what relationship to use in order to calculate Admitted Patients vs. Discharged Patients.
Since out default active relationship between Fact and Date table is based on Fact[Admit Date] -> Date[Date], our Admitted Patients calculation will be very simple as well:
AdmittedPatients:=CALCULATE([DistinctPatientCount])
In order to specify that for our discharged patients and revenue calculations we need to use Discharge Date, we will use USERELATIONSHIP() in the filter clause of the Calculate function:
- DischargedPatients:=CALCULATE([DistinctPatientCount], USERELATIONSHIP(Fact[Discharge Date], ‘Date'[Date]))
- Revenue $:=CALCULATE(SUM([Amount $]), USERELATIONSHIP(Fact[Discharge Date], ‘Date'[Date]))
Now after you hide the DistinctPatientCount from the Client Tools, out model is ready for analysis.
Step 4 – Analysis
Please download the final model here to see how you may analyze this data using Pivot tables or Power View.
