

In this lab we will be implementing a forecasting measure using DAX. We will not be generating a forecast data set, rather, we will create a measure that will look at the actuals from the past to forecast what will happen in the future. We will be using a CDC data set of US Deaths. In fact the Power BI Desktop file used in the lab is directly connected to the dataset, so you can simply hit Refresh in your Desktop file to get the latest data.
As you can see in the picture below, US deaths tend peak out in January and then then bottom out by mid-summer. This variability in values is called seasonality. You will also notice that on average we see a up trend in deaths – as the population grows so do the deaths.
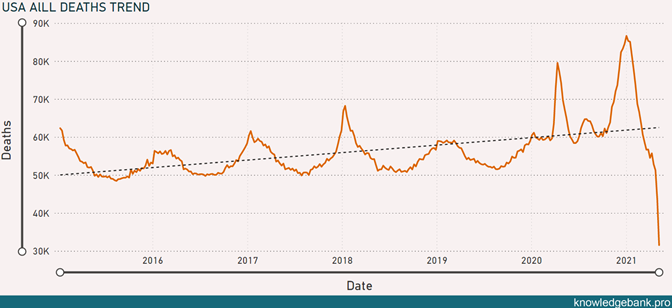
Therefore, in our calculation, we will need to capture both of these components, seasonality and trend.
If you look at the blow line below (which represents the forecasted deaths) you can evaluate how well I did this this calculation.
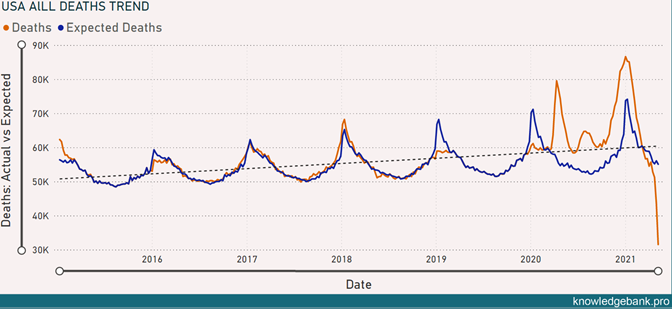
As you can see, the expected deaths are predicted fairly well and you can also see how much higher actual deaths were in 2020 compared to what our forecast was predicting.
Please watch the video for the detailed breakdown of the calculation and you can find the DAX used in the lab below.
Expected Deaths =
var currentWeekNo = SELECTEDVALUE('Date'[WeekNo])
var currentYear = SELECTEDVALUE('Date'[Year])
var sameWeeksPriorTo2020 =
SUMMARIZE(
    FILTER(
        ALL('Date'),
        'Date'[WeekNo] = currentWeekNo && year('Date'[Date])<2020
    ),
    'Date'[WeekID]
)
var deathsinSameWeeksPriorTo2020 =
CALCULATETABLE(ADDCOLUMNS(sameWeeksPriorTo2020, "deaths", [Deaths]), ALL('Date'))
var minDeaths = MINX(deathsinSameWeeksPriorTo2020, [deaths])
var maxDeaths = MAXX(deathsinSameWeeksPriorTo2020, [deaths])
var rowCount = COUNTROWS(deathsinSameWeeksPriorTo2020)
var deathGrowth = DIVIDE(maxDeaths-minDeaths, rowCount-1)

return IF([Deaths]<>BLANK(),maxDeaths+(currentYear-2020+1)*deathGrowth)
