I am very excited to report that as of few days ago, the HTML5 engine for Power View has closed some major gaps with the Silverlight Power View engine.
In February of this year I wrote a post comparing various Power View artifacts between Silverlight, HTML5 and Power BI Windows 8 App. At the time, Silverlight engine was clearly the only choice. HTML5/Windows App engine had a really hard time rendering many of the Power View chart types. I have been checking religiously using the original test file as a reference to see when all of the charts are finally supported by HTML5 and today is the day that I did not see a single error rendering any part of the reference dashboard.
Let’s take a look at the two dashboards above side by side (Silverlight version on the left and the HTML5 version on the right)
As you can see, functionally they are pretty much the same, although there are a few things worth mentioning:
- Background color does not carry over into the HTML5 version
- Carousel control in HTML5 view has all options selected, so I had to click on the first one
- The Scatter plot control does not have the PLAY button to cycle through the months, however it is possible to click on individual months and see the bubbles move to reflect the month selected
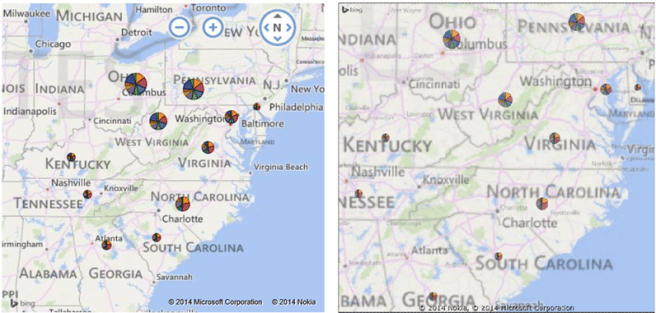
The mapping features is supported in HTML5 now as well fully drillable and interactive (HTML5 on the left and Silverlight on the right)