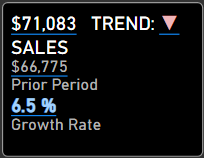
Until now, I have not been very successful with building a perfect KPI visual that would meet my criteria of being able to show the three critical data points that define a KPI for me:
- Actual Value
- Target Value
- Trend (UP, DOWN, SAME)
The out of the box KPI visual has so many limitations that I should probably do a sperate blog just on that and the existing custom visuals in the store do not do a good job of communicating the trend as UP, DOWN, or SAME.
HOWEVER:

Take a look at the KPI control above, not only does it display all the information that I need, but it is also infinitely customizable. You change the fonts, colors, order and just about everything else on this KPI visual because ultimately, it is just a Smart Narrative.
You can download the Power BI Desktop file used in this tutorial here.

Very helpful
Very interesting , good job and thanks for sharing such a good blog.
Very interesting, good job and thanks for sharing such a good blog.
I really enjoyed this post. You really write a good blog.