
There are a couple of options to surface Excel Reports in Power BI Service.
Download the sample file to OneDrive. The file contains a PivotTable report and a Power View report.
- Sign into PowerBI.com and from the left panel click on Get Data
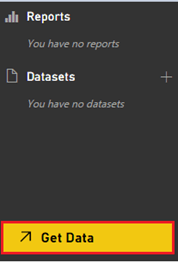

- From the Get Data screen, click on Get button under Files section
- From Get Data > Files screen, click on OneDrive – Business icon
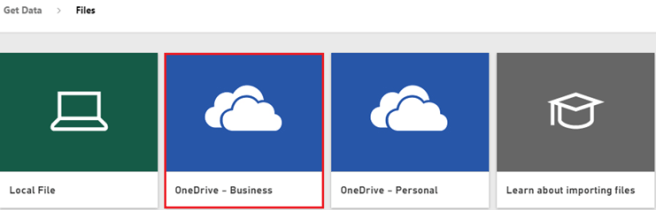
- Navigate to the location of the file selection and click Connect on the top right corner
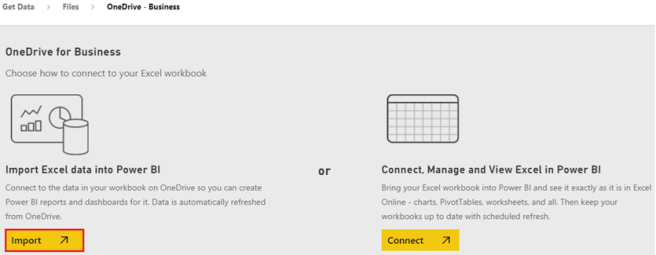
- Two options are available
- Import Excel data into Power BI
- Connect, Manage and View Excel in Power BI
Connect, Manage and View Excel in Power BI
- To surface existing Excel reports, let’s click on Connect button under Connect, Manage and View Excel in Power BI

- Notice workbook is loaded and is available under Reports section in the left panel. No Dataset is created
- Click on ellipsis next to excelReportsInPowerBI under Reports section. Notice there is option to Edit the report and also Refresh it
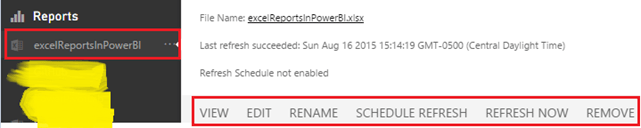
- Click on VIEW
- Notice the report opens in a new window using Excel Services
- Change the Filter in PivotTable report to notice the numbers change
- Navigate to SalesReport tab. If Silverlight warning is displayed, click on the icon on the bottom right corner. This converts Power View report to HTML5. Now Power View is available in the browser and is interactive
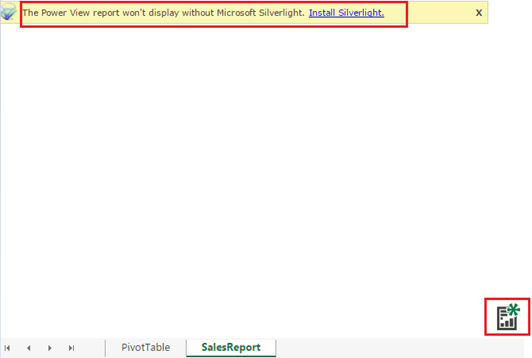
- Notice none of the charts can be pinned to the dashboard
Import Excel data into Power BI
- To have the ability to pin Power View chart elements to the dashboard, follow the same steps to Get Data from the File on OneDrive
- This time click on Import button under Import Excel data into Power BI
- Once file is processed, notice excelReportsInPowerBI is available under Reports panel and Datasets panel


- Clicking on the ellipsis under Datasets provides the option to Schedule refresh
- Clicking excelReportsInPowerBI under Reports, opens the report. Notice PivotTable report is not displayed. Power View report is available and interactive
- There is option to pin the charts to dashboards as well

That’s a nicely made answer to a chlanelging question