Data for the tutorial can be obtained by downloading CSV files from:
https://www.census.gov/popest/data/intercensal/state/ST-EST00INT-02.html
For the tutorial I downloaded data for Alabama, Alaska and Arizona into a folder. Open the CSV files, and notice that all of them have the same layout. In this tutorial we are going to:
- Read data from the folder data source
- Concatenate all the CSV files in the folder
- Notice that state name exists in cell A2 in all the files. We are going to parse the state name from here and add it as a column
- Clean up all the comments
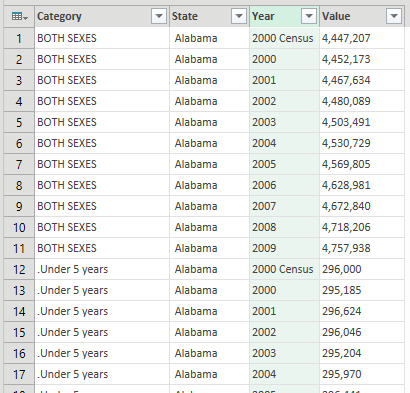
- Delete data for Males and Females and save data for BOTH SEXES
Step 1: Create connection to folder data source
- Open a new Excel work book
- From the ribbon, click on POWER QUERY -> From File -> From Folder
- Dialogue box opens. Browse to the folder where the CSV files are located. Click Ok
- This creates a connection to the folder as the data source
- Query editor opens
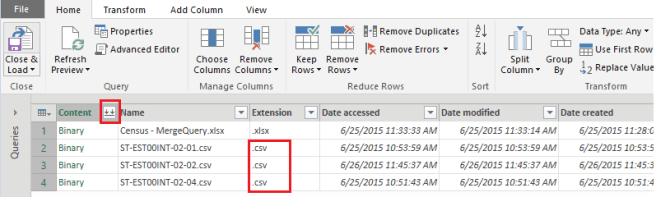
- Notice that an excel file exists in the folder. If you do have other file formats, filter it out by clicking on the arrow next to Extension and select .csv
- Click on the two arrows next to Content. This will concatenate all the CSV files and open it in the query editor
Step 2: Using Power Query to transform data
- To create a column with state names, create a copy of Column1 by right clicking on Column1 and selecting Duplicate Column
- A duplicate column is created all the way to the right. If you are not there already, scroll to the new column
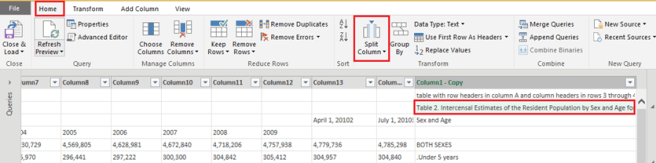
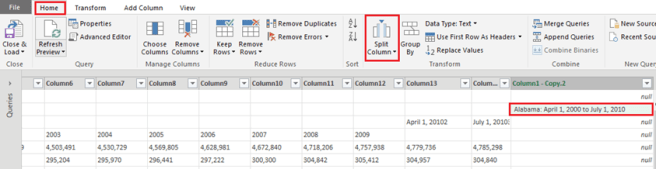
- Select the cell that has the state name. From the ribbon select Home -> Split Column -> By Delimiter
- Split Column by delimiter dialogue box opens
- From the drop down select Custom
- Enter “Table 2. Intercensal Estimates of the Resident Population by Sex and Age for” in the text area below Custom drop down
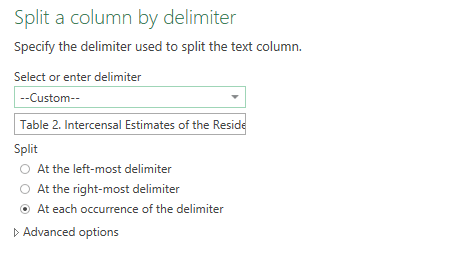
- Click Ok
- Notice column is split into two
- Select Column1 – Copy.1 and right click. Select Remove
- In Column1 – Copy.2 select the cell with the state name in it
- From the ribbon select Home -> Split Column -> By Delimiter
- Split Column by delimiter dialogue box opens
- From the drop down select Colon. Click OK
- Notice column is split into two. One column with the state name we need
- Highlight Column1 – Copy.2.2, right click and select Remove
- Highlight the cell with state name in Column1 – Copy.2.1
- From the ribbon select Transform -> Fill -> Down
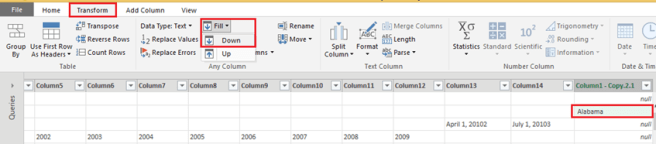
- Notice state name is filled in the columns
- Right click Column1-Copy2.1 and rename column as State
- Scroll to the left and select the first cell in Column1
- Right click and select Text Filters -> Does Not Contain

- This will remove the row. Also notice that there are a few more rows in Column1 which has the word “table” and we need to remove these rows
- From the APPLIED STEPS panel on the right, click on the gear next to Filtered Rows1
- Filter Rows dialogue box opens
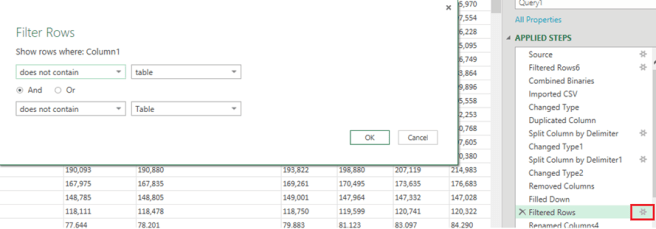
- Replace text “table with row headers in column A and column headers in rows 3 through 4. (leading dots indicate sub-parts)” with “table”.
- Select “And” option and in the second drop down select “does not contain” and enter “Table” in the text area
- Click OK
- This will remove all the rows with the word “table” or “Table” in the Column1
- Similarly remove all rows in Column1 with the word “Sex and Age” by right clicking on “Sex and Age” and selecting Text Filters -> Does not equal
- From the ribbon, click on Home -> Use First Row As Headers”
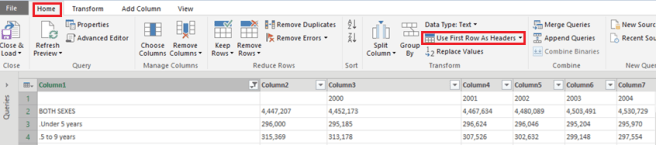
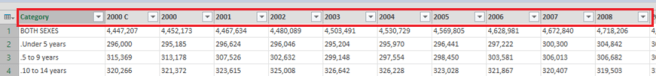
- Rename the first column as “Category”
- Rename column “_1” as “2000 Census”
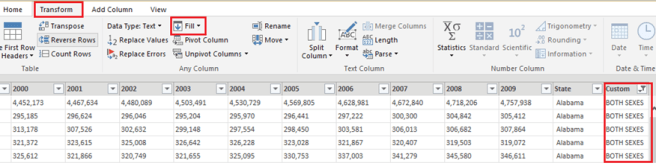
- Notice that in the file there is data for BOTH SEXES, MALE and FEMALE. We want just BOTH SEXES. To achieve this, add a Custom column
- From the ribbon click Add Column -> Add Custom Column
- Add Custom Column dialogue box opens
- In the formula enter following:if [Category]=”BOTH SEXES” then “BOTH SEXES” else if [Category]=”MALE” then “MALE” else if [Category]=”FEMALE” then “FEMALE” else null
- Highlight the Custom column, from the filter select Transform -> Fill -> Down
- Notice Custom column if filled with BOTH SEXES, MALE and FEMALE
- Filter Custom column and select BOTH SEXES only
- Notice this filters out MALE and FEMALE categories
- Scroll to the right and Remove columns _2 and _3
- Highlight all the year columns 2000 Census, 2000, 2001 through 2009
- From the ribbon, select Transform -> Unpivot Columns -> Unpivot Columns
- Rename Attribute column as Year