
Microsoft Power BI team has released a lot of new features to http://app.powerbi.com including lots of formatting enhancements for Q&A (please follow this link for additional details http://blogs.msdn.com/b/powerbi/archive/2015/07/15/new-capabilities-added-to-power-bi.aspx )
In this post I wanted to show you how you might get started on Power Q&A using the Retail Analysis Sample that is currently available in powerbi.com
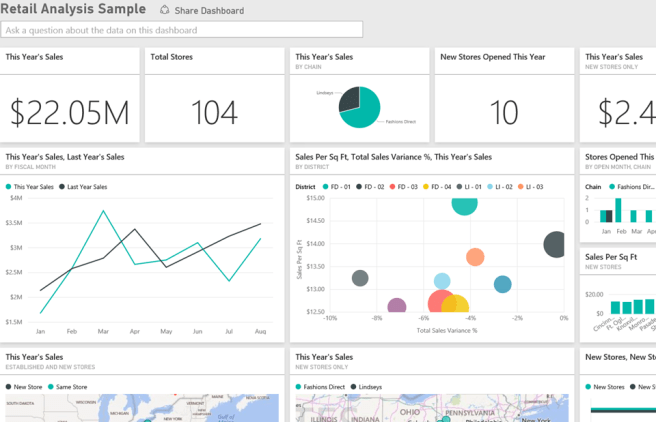
If you don’t see the Retail Analysis Sample on your list of dashboards, please click on  ->Services->Samples->Retail Analysis Sample and you should see a new dashboard added that looks like this
Right below the dashboard title, you will see a text box that says “Ask a question about the data in this dashboard”. The problem is that since you may not know a whole lot about the data set, you may initially struggle with what kind of questions you might ask, so this tutorial will suggest a few for you to try.
This first question to ask is to type this year sales and you should see the answer that looks like this.
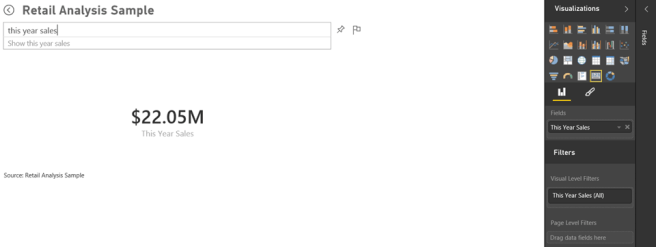
Please note the $22.05M answer right below the question and also please note the rich set of visualizations on the right that you can use to change the default visual that is selected for you automatically (in this case a Card)
Now type this year sales by zip
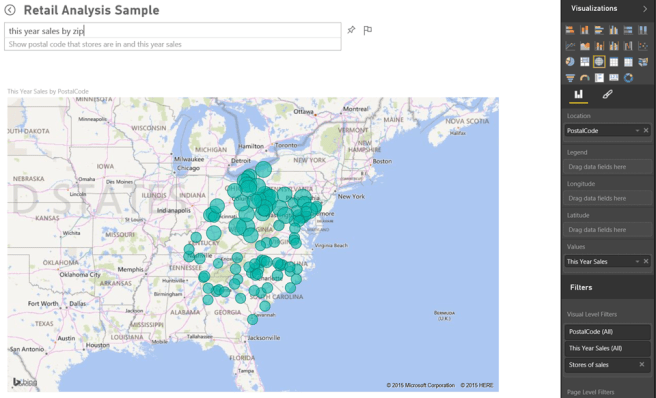
Note that Q&A detected that you are now looking at a geographical information and it decided to present the answer back as a map.
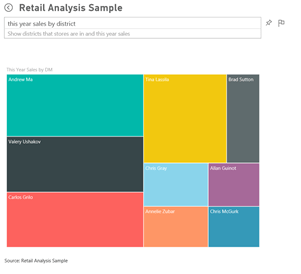
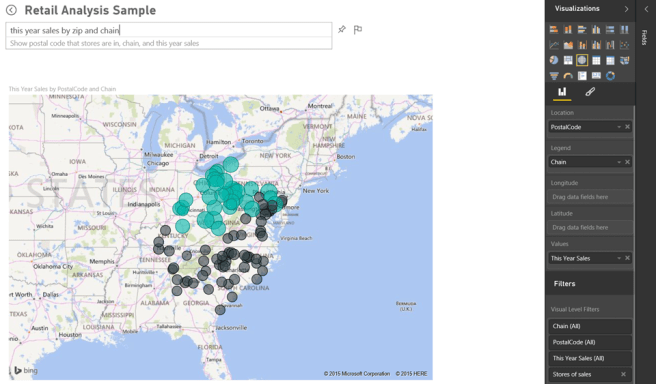
Now type this year sales by zip and chain
And lastly, type this year sales by zip and chain vs last year sales

Now you can click on the Paint Brush icon on the right and pick different colors for your chains. You may end up with a chart that looks something like this
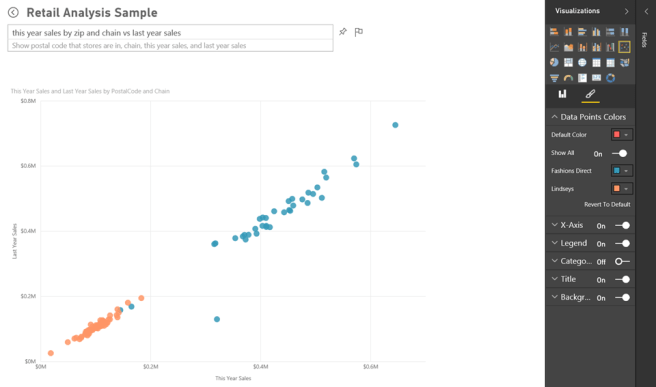
You can pick a different type of visualizations and you can also modify Data Point Colors, X-Axis, Legend, Categories, Title and Background. When you are done with formatting, you can click on a Push-pin icon next to the text box with your question to pin the chart to your dashboard.
Enjoy!
