
Steven Franconeri, a Kellogg School of Management professor, has written a good article “4 keys to Effective – and Honest – Data Visualizations“. I thought that he made some solid points; however, I strongly disagree with his opinion about what makes a chart honest or dishonest.
As you look at the global temperature trend presented in the two charts below, you can see that the chart on the left shows almost no trend, where as the chart on the right shows a dramatic spike in the last fifty years or so.
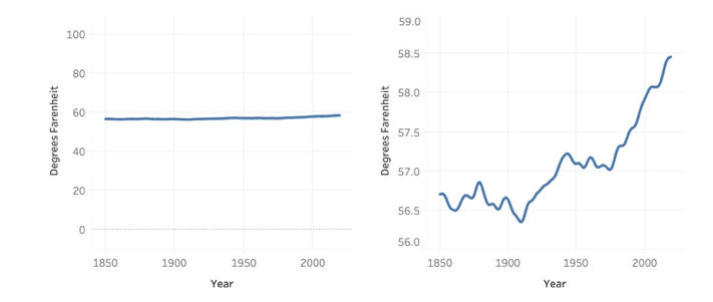
Steven argues that the first chart is dishonest while the second one is not. I argue that both of these charts are equally unethical.
In my Data Persuasion article, I outlined my criteria for the “Musts” of Data Ethics:
- Must not rely on metrics with misleading or contextual definitions
- Must not withhold insight that conflicts with or contradicts with the persuasion objective
- Must have adequate levels of details and scale
- Must provide relevant time range and context
- Must compare local and global contexts when possible
You can clearly see that these charts violate points #2, #3 (only for chart 1) and #4 and if these violations are not clear to you then you are probably as affected by your confirmation bias as our distinguished Kellogg Professor. As long as the data are accurate, neither data nor the charts are dishonest per se. It is the intention of the storyteller that makes a presentation to be manipulative and dishonest.
My advice is the following – always make sure that the opposing point of view is covered in your presentation. You want to present arguments against your point of view while having an opportunity to defend your own position. Otherwise, your credibility and reputation will suffer, and you may never get a chance to gain trust of your colleague or a customer again.

I would like to leave a third opinion here – I mentally dismissed both charts. I find that when you have two bad charts side-by-side, they tend to cancel one another out making the reader dismiss the data totally. But I did a second look and I noticed that the y-axis is just not set appropriately for the visual display of data (neither one appropriate for the individual chart). And this y-axis manipulation is just one of many topics discussed by Alberto Cairo in his book , “How Charts Lie”.
I would like to leave a third opinion here – I mentally dismissed both charts at first seeing that they were using the same data. I find that when you have two charts side-by-side that use the same data, they tend to cancel one another out making the reader dismiss the data totally unless you justify the reasons for such a display. Upon second look, I noticed that the y-axis is just not set appropriately for the visual display of data (neither one appropriate for the individual chart). I’ll note that this y-axis manipulation is just one of many topics discussed by Alberto Cairo in his book , “How Charts Lie”. Very informative read.