
Calculation Groups is a powerful modeling capability in Power BI that allows us to dramatically reduce the number of measures in a model. Calculation Groups also have a dynamic formatting feature that allows us to specify a different format for our measures ($$ vs. %) on the same chart.
Author: Business Intelligist
US Economy: Obama vs. Trump
Who was a better president for the US economy? Trump vs. Obama... Obama vs. Trump... I go over the US Census economic indicators and compare how the US economy performed during the last several administrations. Make your own conclusions by exploring these numbers here: https://bit.ly/2RQ2jr0 US Census Economic Indicators: https://www.census.gov/economic-indicators/
COVID19 – Total Impact on US Deaths
According to the official statistics, there are almost 70k deaths in USA as of first week of May 2020.I am trying to find these deaths in the overall weekly US deaths in the CDC dataset and failing miserably. Our Coronavirus (COVID-19) dashboard is available here: https://bit.ly/2voUAbx Weekly U.S. Influenza Surveillance Report: https://www.cdc.gov/flu/weekly/index.htm Weekly US Deaths: … Continue reading COVID19 – Total Impact on US Deaths
Price Volume Mix (PVM) for Gross Margin Variance Analysis
I have covered Price Volume Mix (PVM) analysis for Revenue Variance in the earlier article. I recommend that you take a look at it first because PVM for Revenue variance analysis is much easier to understand as there are fewer moving parts to think about in the calculations. Assuming that you are now well versed … Continue reading Price Volume Mix (PVM) for Gross Margin Variance Analysis
Price Volume Mix (PVM) for Revenue Variance Analysis
EDIT 2021-01-12: the latest post and a video on how to calculate a perfect PVM is available here: DAX for the Perfect Price Volume Mix (PVM) Calculation (Power BI Tutorial) EDIT: the most recent post about this topic (and a video) can be found here: https://businessintelligist.com/2020/11/20/the-definitive-guide-to-price-volume-mix-calculation-pvm-in-power-bi-theory/ The first time I covered PVM for Revenue analysis, … Continue reading Price Volume Mix (PVM) for Revenue Variance Analysis
COVID19 vs. US Economy – My Analysis of US Economic Indicators for Retail (March 2020)
We all know that COVID19 has devastated the US economy. The question is how much? I have built a dashboard using the US Department of Commerce dataset for US Economic Indicators. The March numbers are in and they are depressing. I go over the numbers in my latest video. The dashboard is available here: https://bit.ly/2RQ2jr0
The Quality and Transparency of COVID19 Data is Unacceptable
Publicly available data for COVID19 is OK for basic trending; however, there are too many data inconsistencies in the data set. Much of relevant data is not publicly available. If our societies are to incur major costs (both financial and with respect to social liberties) then the powers at be must provide all of the … Continue reading The Quality and Transparency of COVID19 Data is Unacceptable
COVID19: Sweden – Was Not Wrong
Was Sweden's approach to COVID19 right? It's too early to tell, but so far, it's also hard to say that Sweden was wrong. More details in my video https://lnkd.in/ejBrVfx . Link to our COVID19 dashboard: https://bit.ly/2voUAbx.
COVID19: Sweden – Doing it Her Way
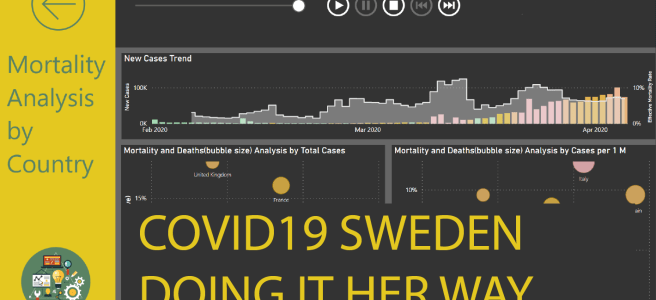
As you might know, Sweden has chosen a dramatically different approach to dealing with COVID19 pandemic. Instead of shutting down its economy as most other countries have done, Sweden has chosen to keep the restaurants and the borders open. They are, however, doing a bunch of other things to fight the disease. In my latest … Continue reading COVID19: Sweden – Doing it Her Way
Coronavirus (COVID-19) Trends Analysis for April 7, 2020
Just posted a new video in which I go over the latest trends as of yesterday https://youtu.be/h5Xt6lCVRRM We also added a forecasting page to the dashboard, it's still in alpha but it does provide some useful insight on when the new cases will drop by 75% and when they will go down to zero
