
In this post I will review the latest version of SAP Visual Intelligence – 1.08 – and see how it stacks up against the Microsoft self-service BI tools, Excel, PowerPivot and PowerView. In the initial release, Visual Intelligence only supported SAP Hana, but in its latest iteration few other data sources are supported:
- CSV File
- SAP Hana
- SAPBW as exposed as a view in SAP Hana
- MS Excel
- Freehand SQL (basically ODBC)
- SAP Business Objects Universe
Just to clear some confusion that this list may generate, Visual Intelligence does not access BW objects directly, instead, Hana has some connectivity to connect to BW models, DSOs and Query Snapshots and then expose those as a Hana view, in short, Visual Intelligence knows how to plug into Hana but not BW.
Data import
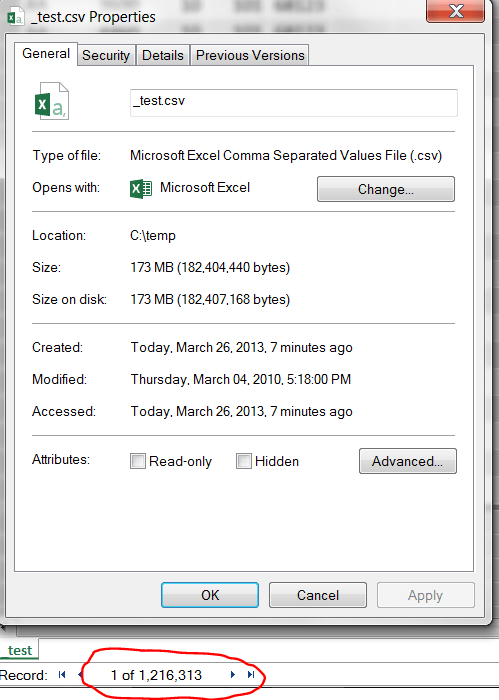
Since I don’t have Hana running on my laptop, I decided to use a CSV file to load in both Visual Intelligence and PowerPivot. I used a 173MB file that contained about 1.2M records in it. It took just under 30 seconds to import the file: 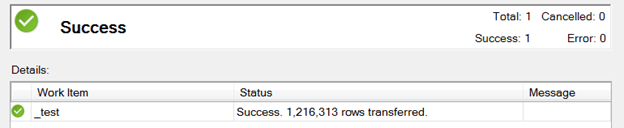
After that I was able to bring the data into the pivot table and start slicing and dicing it. Loading data in Visual Intelligence wasn’t quite as smooth. Having selected the same file, I had to wait for almost 40 seconds looking at the frozen screen. 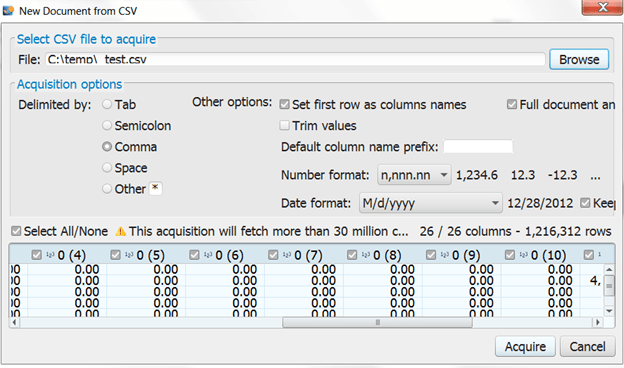 Then, after the meta data have been read, I clicked on Acquire. After about a minute of looking at the spinning cursor, I was rewarded with a warning message:
 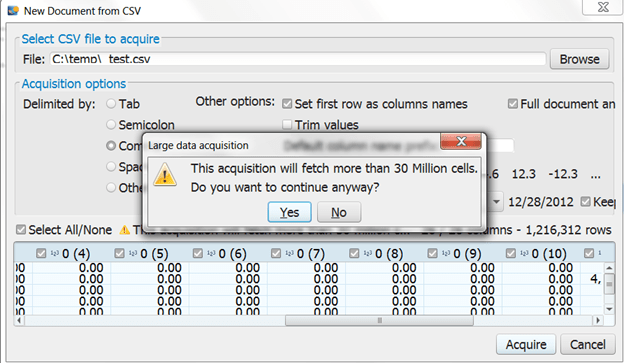 I was surprised to find out that the acquisition will fetch more than 30 million cells, but having been known to boldly go where no man has gone before, I took my chances and bravely hit the Yes button. Unfortunately, that was as far as this adventure would take me with respect to that data file, as the following message ended my hopes of being able to analyze a meekly 1.2M of rows of data.
 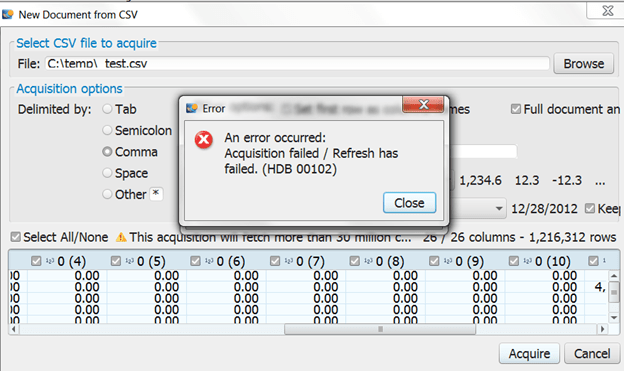 I have not been able to find the theoretical cell limit for Visual Intelligence, all I know is that my data file had 1.2M of rows and fewer than 30 columns, but it was clearly too much.
Lesson #1: Do not plan to use Visual Intelligence on datasets larger than 1M rows.
I therefore had to resort to a much smaller file for my testing, so I used some baseball stats CSV file with 95K rows. I was able to finally load that file into Visual Intelligence after about 20 second wait… a similar task in Excel took 7 seconds.
Data Exploration
Before I jump into data exploration, we have to take a quick pause and think about the audience for it. I think it makes sense to partition the audience up by technical vs non-technical users (IT vs the rest of the world) and I am going to ignore the technical audience altogether in this review because I think that the primary market for data exploration is the non-technical audience. Also, I have to divide that non-technical audience in two groups, Power User and Novice. I realize that most people are actually somewhere in between, but I think that reviewing these tools in the light of those two outliers will give us the best context for forming an opinion. Another thing I have to say that I am probably a PowerUser outlier within the PowerUser group and therefore it is very difficult for me sometime to just see this tool from the complete Novice perspective, but I will definitely try to do my best. So, here is what I think about my data exploration experience. Visual Intelligence does a decent job of inferring measures, attributes and hierarchies out of the data. When I say decent I mean that to somebody who has completely no clue about data, does not know how to sum data up in excel, it does a job good enough to get one going. For me, however, it was a very frustrating experience as the tool tried to do everything backwards from the way I am used to. For fairness sake, I am sure that if I spent more time using the tool, I am pretty sure I would be able to get comfortable with it. But being as it was, I was able to create a Line chart and a Bar chart that looked like this 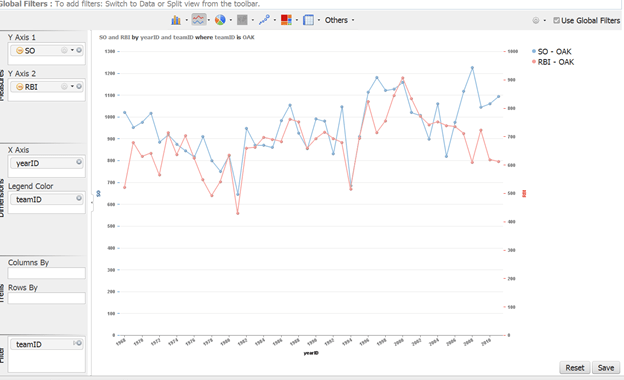 Visual Intelligence has a number of different chart types available, some of which are not available in excel:
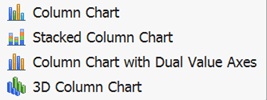
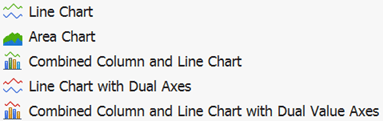

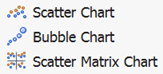

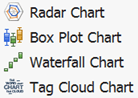
The chart I was excited the most was the Waterfall chart as it is not offered in excel, although it is possible to create one with a trick that I will have to write about in another post. But, this is where I ran into my second biggest disappointment with the product, you can only create one chart at a time. In other words, one cannot create a dashboard that would show a trend chart and a donut chart on the same page.
Lesson #2: Visualizations are limited to only one chart at a time.
Modeling
This is my biggest disappointment with the product which, frankly speaking renders it virtually useless for a power user. Modeling is practically not existent in Visual Intelligence. Although the tool does a good enough job for a Novice level user with some basic calculations and hierarchies, it is impossible to add additional data to the model. In my case, I was able to load the batting data into Visual Intelligence, but I was not able to load any team related information as a dimension so I could slice the batting data by team attributes. Essentially, the only way to do this would have been to add all of the team attributes to the batting file, but that would dramatically increase the number of cells in the data set and we already know that the tool does not like that very much.
Lesson #3: Visual Intelligence offers virtually no modeling capabilities outside of basic calculations and hierarchies.
Collaboration
After one creates a particularly good looking chart (we already know that anything beyond that is not supported in VI) one has find a way to share one’s work with the world. In the Microsoft world, an Excel file that contains both a PowerPivot model (data) and traditional excel charts or PowerView dashboards/reports, that file can be simply saved into SharePoint that then will render all of the visualization to and end user as a web page. No such luck with Visual Intelligence as its visualizations are saved as just in image in to the Streamwork portal and the end user will not be able to interact with it online. Lesson #4: Visual Intelligence is a fat client solutions, no collaboration or online viewing is available.
Random tidbits
- Calculations in VI are very simple, nothing like PowerPivot with respect to time intelligence, financial intelligence, balance sheet logic, etc.
- Charts in VI are not drillable, they are in PowerView
- No drilling to detail in VI, there is one in Excel
- No dimensional modeling in Visual Intelligence, there is on in PowerPivot
- Tree map is available in VI, not in Excel, heat maps are available in both, although more intuitive in VI than excel (conditional formatting)
…. More things to come later tonight…

Reblogged this on Says My Mind.
Excel have maps and card Objects for show The images !
What would you recommend for BI, EXCEL or VI + BW. If my excel capabilities are very high.
Regards
I have not found a good usecase for where I would use VI over Excel yet, unless I am trying to use VI as an exploration tool against Hana
Hi,
I’m interested in the waterfall trick for PowerPivot 😉 Did you write something about ?
Regards
Hi,
Your write-ups are great. Thank you for sharing them on this blog. I’ve built some data models for reporting and analysis in powerpivot. Then, I tried to reproduce the results in VI (SAP Lumira). But, as you have said, it is not possible to create multi-table models and the workarounds are not satisfactory.
Q: Is the reason for this due to the lack of data engine like the Vertipaq in VI?
I’m trying to understand how easy or difficult it would be for SAP to implement powerpivot-like modeling features in VI? If it is difficult, then I’d conclude use cases requiring a data model, with the model being portable for offline work, are not suitable for HANA/VI.